Ever wonder why our economy rises and falls? Why can’t the market continue to just go up slowly, without declining?
The purpose of this post is to explain the economic business cycle, factors that effect it, why a declining market is good, and try my best at explaining our current business cycle.
What is GDP and Why Does It Matter?
Gross domestic product or GDP is the value of goods and services produced in the U.S.
The U.S. Bureau of Economic Analysis is in charge of tracking the U.S.’s GDP. When the economy is at its highest, so is the GDP. When the GDP is declining, so is the economy.
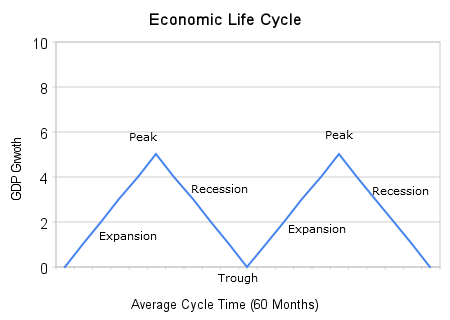
The chart above shows the typical economic business cycle as measured by the GDP over 5 years.
The Economic Business Cycle Factors
Three factors that influence GDP are:
- Inflation – Inflation is the increase in prices over time. When prices increase, you lose purchasing power. Over the past 60 years, inflation has averaged around 3% per year. The U.S. Bureau of Labor Statistics. tracks inflation in many ways, but primarily through the Consumer Price Index or CPI. The CPI is the price of a pre-determined basket of goods and services. A certain level of inflation is good for the economy. Inflation gives an individual the incentive to spend money today, rather than wait. Therefore, inflation is benefits the economy because it encourages consumption rather than saving, which increased GDP.
- Interest Rates – Interest rates are the cost of buying money. Through a few different means, the Federal Reserve controls interest rates. The goal is to control inflation and the money supply with interest rates. For example, if the economy is at a peak and the Federal Reserve is worried about excessive inflation, which can be harmful. The Fed, would want to decrease the money supply by increasing the interest rates.Therefore, it would become harder to buy money.
- Unemployment – When unemployment is low or very few people are looking for jobs, the economy is strong. When more people have jobs, there is more consumption in our economy. The increase in consumption increases the GDP. Unemployment claims are reported each week by the U.S. Department of Labor.
The below chart shows where inflation, interest rates, and unemployment are at during each cycle of the economy.
Economic Indicators
| Peak | Recession | Trough | Expansion | |
|---|---|---|---|---|
| Inflation | Highest | Decreasing | Lowest | Increasing |
| Interest Rates | Highest | Decreasing | Lowest | Increasing |
| Unemployment | Lowest | Increasing | Highest | Decreasing |
| GDP | Highest | Decreasing | Lowest | Increasing |
Where Are We Today?
As of today, inflation and interest rates are low. Unemployment is high.
Reported on September 15, the CPI rose .4% in August. The past 12 months, the CPI has decreased 1.5% total. Therefore, the rise in the CPI was positive news.
The Federal Reserve last met in August 11. They didn’t change the discount rate during their last meeting. Their next rate announcement comes September 22.
There was a slight decrease in unemployment claims from the previous week. The 4-week moving average is also declining. Both are very good signs.
Overall, it looks like we may have hit the trough and we have good times ahead. However, there is no telling the future.
In the comments below, please explain where you think we are on the economic business cycle?
Comments on this entry are closed.